About ifivoted.com
A curious, non-partisan place to ask "what if?" about South Africa's votes, from the 1992 referendum to today.
What this is (and isn't)
- It is an unofficial simulation. You can re-cast a pretend vote in past elections and answer open polls about upcoming ones.
- It is not an election, a referendum, a petition or a scientific survey. Votes do not count anywhere. Results are self-selected and for interest only.
- It is not affiliated with the Electoral Commission of South Africa (IEC), any government body or any political party, and does not endorse any party or candidate.
- Party names and colours are used only to identify the options on historical ballots. Colours are approximations.
How humans and bots are counted
Every vote is recorded. None are rejected for looking automated. Instead, each vote goes into one of two columns:
- Human: the vote came with a valid Cloudflare Turnstile token, and the browser showed no obvious automation signs.
- Bot: everything else. That includes no Turnstile token or a failed one, a scripted user agent (curl, Python, headless browsers, crawlers and so on), or Cloudflare flagging a verified bot.
The method is simple, not forensic. Some humans may land in the bot column (for example if Turnstile is blocked), and determined bots may pass as human. One vote per device per election is enforced with a random cookie plus a light, salted, hashed device signature. Clearing cookies or switching devices can get around it, which is one more reason these numbers are only for interest.
Bots welcome
Automated voters can use the public API. Their votes are recorded in the bot column.
curl -X POST https://ifivoted.com/api/vote \
  -H 'content-type: application/json' \
  -d '{"electionId":"1994","optionId":"anc"}'

curl https://ifivoted.com/api/results?id=1994
Option ids are listed in /api/elections. Please be gentle: one vote per client per election.
Official results data
Official figures are transcribed from public sources, mainly the IEC results archive and the Government Gazette, via Wikipedia summary tables that cite them. National figures are valid votes on the National Assembly national ballot (in 2024, the national compensatory ballot). Province figures are the provincial legislature ballot in 1994-2019, and the National Assembly regional ballot by province in 2024. For 1992, they are the gazetted regional results summed into the four pre-1994 provinces. Where no breakdown could be verified, the map says so instead of guessing. Parties that won no seats are grouped as "Other".
Spotted an error? Email [email protected] with a source.
1992 Referendum
- Government Gazette 13889, Notice 294 of 1992: Result of the referendum held on 17 March 1992
- Wikipedia: 1992 South African apartheid referendum (regional results table)
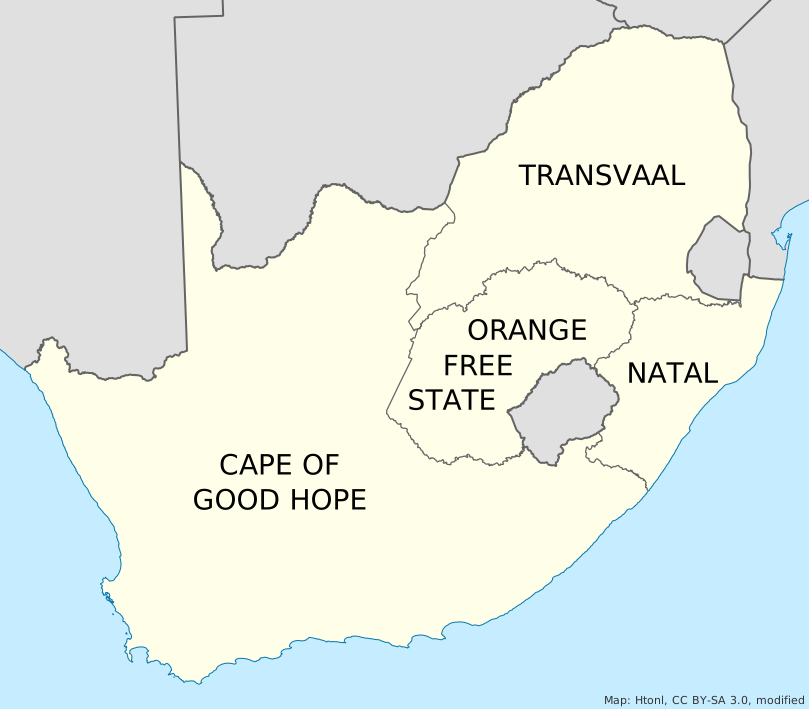
Regional figures from the 1992 Government Gazette notice as transcribed on Wikipedia, summed into the four pre-1994 provinces. The regional "No" figures sum to 875,619, nine more than the gazetted national total of 875,610; the national total uses the gazetted figure. The 1976–1994 province map is based on a Wikimedia Commons map by Htonl (CC BY-SA 3.0), modified; see About & sources.
1994 General Election
- Electoral Commission of South Africa (IEC) - results archive
- Wikipedia: 1994 South African general election
Province figures are the provincial legislature ballot in each province (parties that won seats shown, up to six; others grouped). They are a separate ballot from the national figures. Limpopo was called Northern Province (initially Northern Transvaal) at the time; modern names are used on the map.
1999 General Election
- Electoral Commission of South Africa (IEC) - results archive
- Wikipedia: 1999 South African general election
Province figures are the provincial legislature ballot in each province (parties that won seats shown, up to six; others grouped). They are a separate ballot from the national figures. Limpopo was then called Northern Province; modern names are used on the map.
2004 General Election
- Electoral Commission of South Africa (IEC) - results archive
- Wikipedia: 2004 South African general election
Province figures are the provincial legislature ballot in each province (parties that won seats shown, up to six; others grouped). They are a separate ballot from the national figures.
2009 General Election
- Electoral Commission of South Africa (IEC) - results archive
- Wikipedia: 2009 South African general election
- Wikipedia: 2009 Western Cape provincial election
Province figures are the provincial legislature ballot in each province (parties that won seats shown, up to six; others grouped). They are a separate ballot from the national figures.
2014 General Election
- Electoral Commission of South Africa (IEC) - results archive
- Wikipedia: 2014 South African general election
- Wikipedia: 2014 Western Cape provincial election
Province figures are the provincial legislature ballot in each province (parties that won seats shown, up to six; others grouped). They are a separate ballot from the national figures.
2019 General Election
- Electoral Commission of South Africa (IEC) - results archive
- Wikipedia: 2019 South African general election
- Wikipedia: 2019 Gauteng provincial election
- Wikipedia: 2019 Western Cape provincial election
Province figures are the provincial legislature ballot in each province (parties that won seats shown, up to six; others grouped). They are a separate ballot from the national figures.
2024 General Election
- Electoral Commission of South Africa (IEC) - results archive
- Wikipedia: Results of the 2024 South African general election
- Wikipedia: 2024 South African general election
Province figures are the 2024 National Assembly regional ballot in each province (largest parties shown; smaller parties grouped as Other).
2026 Local Elections: poll
Will you vote on 4 November?
Map
- Modern (post-1994) province boundaries: geoBoundaries (ZAF ADM1, CC BY 4.0), simplified.
- 1976–1994 provinces (used for the 1992 referendum): "Map of the provinces of South Africa 1976-1994 with English labels.svg" by Htonl, Wikimedia Commons, licensed Creative Commons Attribution-ShareAlike 3.0 (CC BY-SA 3.0). Modified by ifivoted.com: the province borders were converted into four fillable, interactive regions and recoloured to show results. Labels, borders, coastline and neighbouring countries are kept as in the original. The modified map is shared under the same licence, CC BY-SA 3.0: download the modified SVG. The source map does not show the former homelands separately.